Contents:
- > Background
- > The Hacker News affect
- > Bad news
- > Good news
- > API traffic for the tool
- > Dashboard for the get-analytics cloud function
- > Dashboard for the page-view-logger function
- > The Solution
- > Idea 1: Use global objects
- > Idea 2: Store the results themselves in the database
- > Idea 3: Forget DataStore, use buckets
- > Further improvement
Background
I posted a previous article (about building an analytics tool) onto the Hacker News forum. It was quickly buried and didn't get any attention.
To my surprise, I received an email from a Hacker News administrator (Daniel) explaining that it was a good quality post and would be boosted to the front page at a random time within the next couple of days.
Sure enough, in the early hours of the next morning, the post was boosted. I woke up to various notifications that people had started following me on twitter, which never happens. After delegating the kid's breakfast duties, I logged into GCP to see what affect the extra traffic had on my experimental tool.
The Hacker News affect
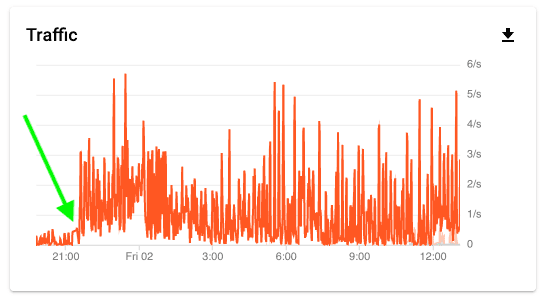
Traffic had increased by about 30x and my hastily built tool was looking very sub-optimal. Two problems stood out - the aggregated analytics data was taking anywhere from 20 - 30 seconds to load (up from around a passable-ish 5 under normal conditions), and I was running up a bill of around €10/day.
Bad news
The reason for both of these problems was a shockingly inefficient and lazy approach to serving the analytics.
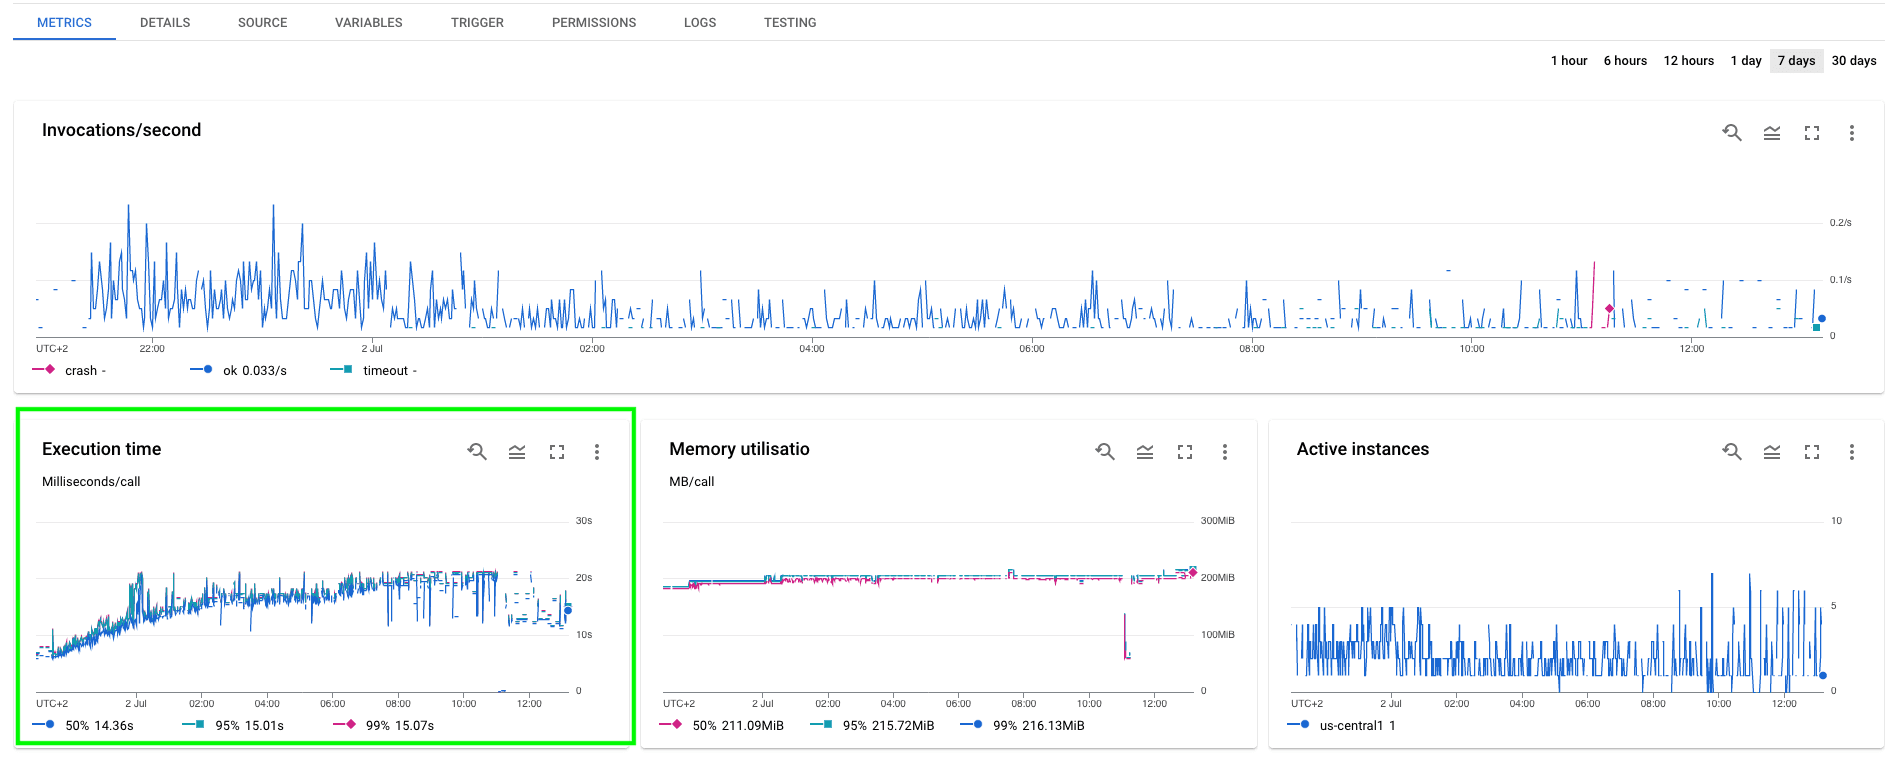
Each time the analytics page was loaded, a cloud function would fetch all the data in the DataStore database, munch all that data and return a freshly derived blob of JSON. Never mind that almost the exact same computation had occurred hundreds of times already.
As the amount of data in the DataStore increases, so does the time required to
serve the analytics page. In the second chart below (dashboard for the
get-analytics cloud function), it looks like the execution
time increases at a rate of O(log n).
Good news
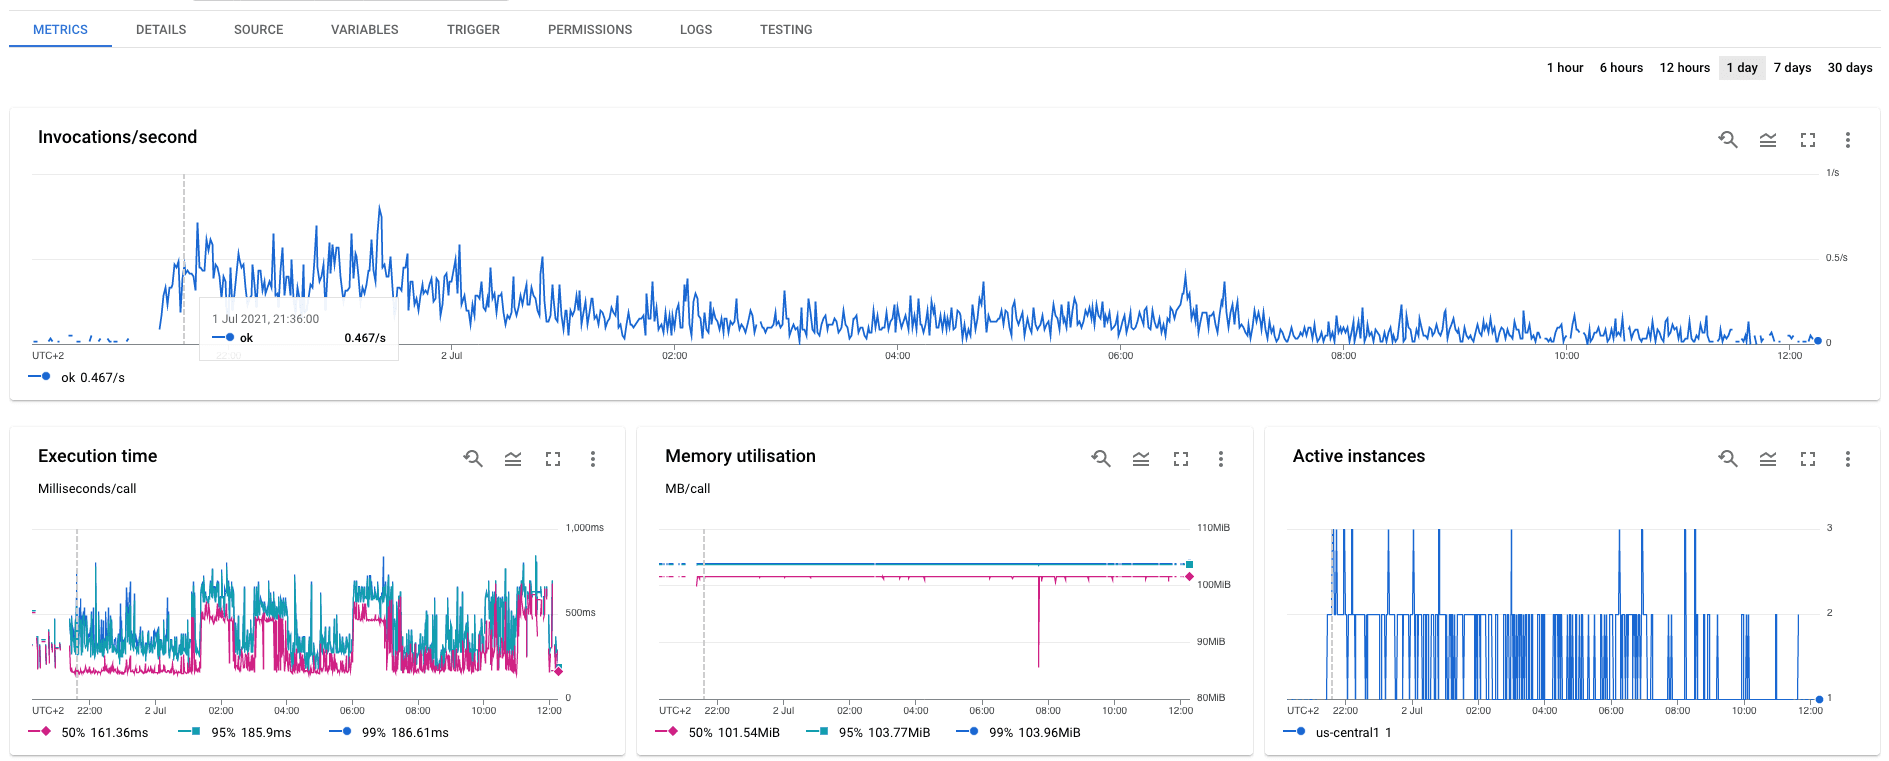
The good news though was that the page-view-logger function was handling the
extra traffic smoothly. You can see in the dashboard image below (click on it)
that almost every request was completed in less than 200ms, which I think is
fine for a background process. I could also see the active instances
scaling up and down well within its preset limits, as expected.
API traffic for the tool

Dashboard for the get-analytics cloud function

Dashboard for the page-view-logger function

The Solution
I began to ponder the importance of all the things I didn't know about databases, and what DataStore might be good and bad at doing. Scrolling through the documentation I could see google boasting of super quick writes, but not super quick reads. I'd already seen how many API calls were being made to the Cloud DataStore API and knew I'd probably have to redesign part of the tool.
Idea 1: Use global objects
I attempted a few easy wins, mostly using the idea that if an instance of a function was invoked multiple times before being powered-down then global objects would still be available in memory.
If I put the data collected from the DataStore into a global object then I could check for its existence in subsequent function calls. This would save a lot of API calls and likely remove the largest bottleneck, saving my readers 10+ seconds of watching a loading spinner.
For whatever reason, this didn't work. Even if it had, the tool could still be vastly improved by taking a different approach that would be even faster and also reduce costs. I'd like to have this tool running indefinitely so reducing daily costs to an absolute minimum is important.
Idea 2: Store the results themselves in the database
It was obviously inefficient to repeat the same calculations multiple times. A good long-term solution would require aggregating the data periodically and then fetching and serving these aggregated data to the client.
I tried putting the JSON into the DataStore using a different key, but ran into errors about the data for each entity being too large. Even if I split the aggregated data into multiple component parts it would still be too large, and would grow over time. I guess DataStore isn't meant to be used like this.
I probably could have pursued this idea a bit further, but I didn't want to change the structure of the JSON blob served to client. If I did change it then I'd need to rewrite the client side JavaScript as well.
Client side work is faster than back-end, but writing JavaScript is fiddly compared to Python in my opinion. There's always multiple ways of doing a thing, and several versions of an API, so googling a solution isn't as simple as for Python.
Idea 3: Forget DataStore, use buckets
Final idea - store the results as a JSON blob in a Storage bucket and point the client at the bucket instead of the Cloud Function.
Turns out this is a super fast and efficient solution. /metrics now loads in less than half a second, and the only variable costs are egress on the bucket, which will be much smaller than the comparable costs of running a Cloud Function.
The computation expense of calculating the analytical results is fixed and decoupled from the number of page views using the following method:
- Every few minutes Cloud Scheduler targets a Pub/Sub topic.
- The topic triggers a Cloud Function.
- The Cloud Function then:
- Queries the DataStore and collects the data.
- Calculates the analytics results.
- Generates a JSON blob containing the results.
- Pushes the JSON to a storage bucket which is available to a client.
Further improvement
The aggregated results for days other than the current day are still needlessly recalculated - once midnight rolls around the results are clearly not going to keep on changing.
Instead of having one JSON blob containing data for all the last 30 days, I could have a blob for each day (or perhaps each week). This would reduce the amount of data extracted from the DataStore. This would reduce costs and computational expense.